Introduction
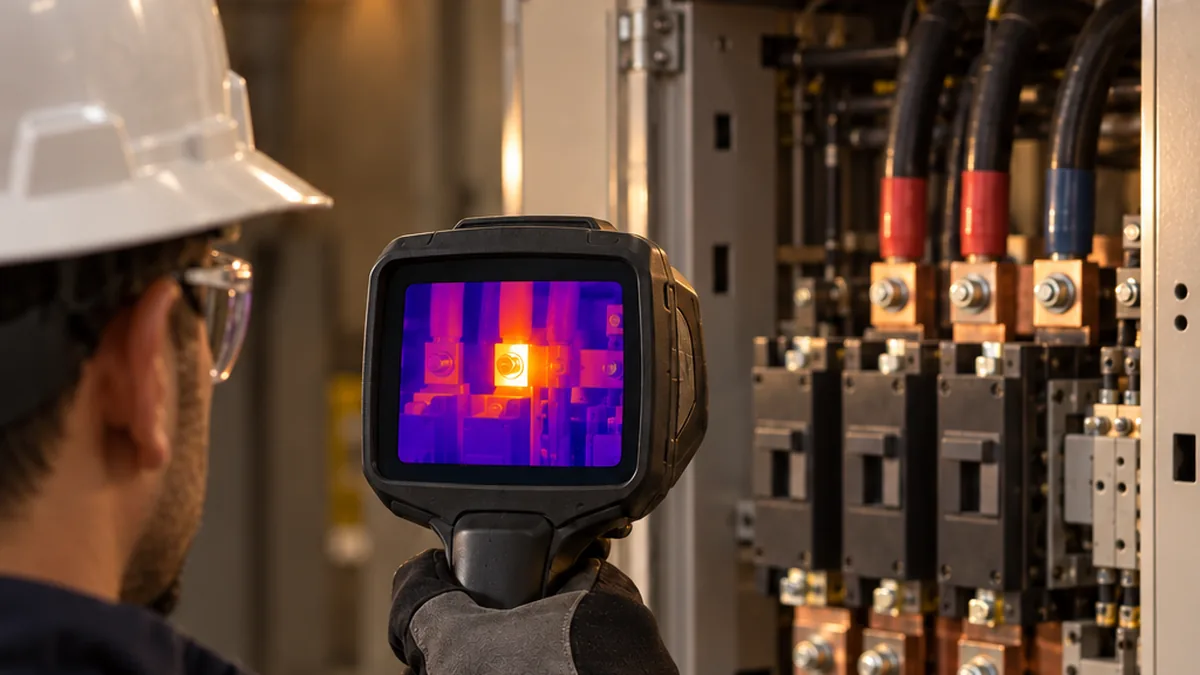
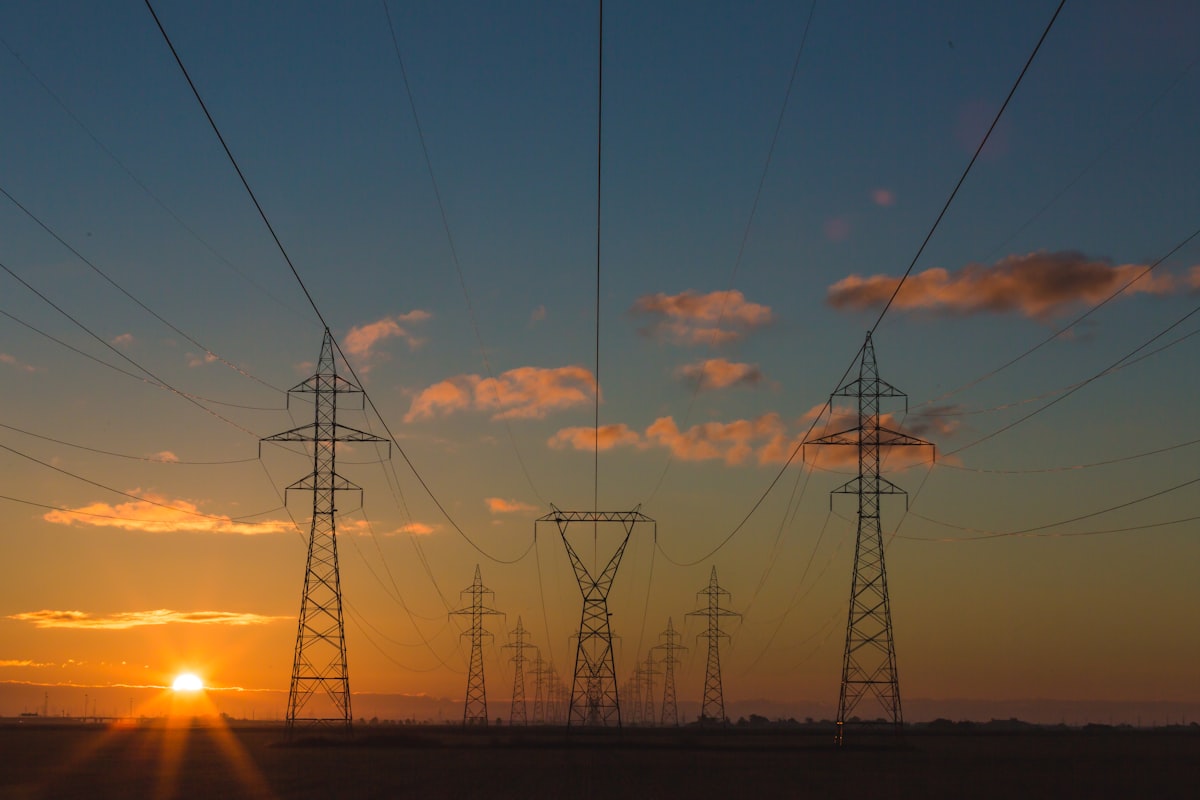
Thermography in industrial transformers is an essential technique for diagnosing abnormal heating, reducing electrical failures, and increasing the reliability of critical facilities. In industrial operations, transformers play a central role in power distribution, and any relevant thermal deviation may indicate risk of degradation, performance loss, or functional failure with direct impact on production.
For that reason, thermographic inspection in transformers should not be treated only as image capture. It needs to be understood as a technical condition assessment process, combining thermal analysis, operating context, asset criticality, and severity criteria. When correctly applied, thermography strengthens predictive maintenance and improves intervention decisions.
Why transformers require regular thermographic inspection
Transformers are exposed to different sources of thermal stress throughout operation. Overload, poor connections, phase imbalance, inadequate ventilation, aging components, and problems in bushings or busbars can generate relevant hot spots. In many cases, the thermal signal appears before visible symptoms or before protective systems act.
The great advantage of thermography is that it allows these anomalies to be observed without direct contact with energized parts and without dismantling the system. This makes the technique especially valuable in periodic predictive maintenance routines, where the goal is to identify degradation trends before failure occurs.
- Detects localized heating in critical components
- Allows action before unplanned failures
- Reduces exposure to invasive inspections
- Generates technical evidence for maintenance prioritization
What to observe in a thermographic inspection of transformers
A useful inspection depends on well-defined criteria. It is not enough to observe the maximum temperature captured by the camera. It is necessary to evaluate load condition, ambient temperature, comparison between phases, equipment history, observed surface, emissivity, and measurement position. In similar assets, relative comparison is often more informative than an isolated reading of absolute temperature.
In industrial transformers, the analysis should cover connections, terminals, bushings, associated busbars, and regions where current flow may produce abnormal heating. In certain scenarios, small thermal differences may be highly relevant if they are located at electrically critical points.
Main failures that thermography can reveal
Thermography does not show the electrical failure directly, but it reveals its thermal effects. This distinction is important because the thermogram must be interpreted on a technical basis for the diagnosis to be consistent. In transformers, certain patterns are often associated with specific failure mechanisms.
Common field findings
- Loose connections or elevated contact resistance
- Heating in bushings and terminals
- Phase imbalance
- Overload in an associated circuit
- Deterioration in busbars or secondary connections
- Abnormal thermal difference between equivalent components
These findings must be correlated with electrical measurements, operating data, and maintenance history. The thermogram shows where the thermal deviation is, but root cause definition requires integrated interpretation with other technical evidence.
How to classify the severity of abnormal heating
Prioritize findings using load, manufacturer limits, measurement quality, thermal history and equipment criticality. Record the comparison reference and the technical rationale for the proposed action. This article does not prescribe universal temperature bands or repair deadlines.
How to improve thermographic report quality
A thermography report for transformers should enable traceability and decision-making. This requires clear asset identification, anomaly location, load condition at the time of inspection, visual image, thermal image, severity criterion, and an objective action recommendation. The more standardized the report, the greater the maintenance team's ability to act safely and accurately.
In addition, consistent reports form a historical basis for comparison between campaigns. In mature predictive maintenance programs, this history helps validate corrections, track thermal trends, and recognize recurring patterns in similar transformers.
Practical applications in predictive maintenance
Thermographic inspection of transformers can be used in different operating scenarios, from periodic industrial substation routines to targeted campaigns after load changes or suspicion of anomaly. Its greatest value appears when thermography is incorporated into the asset management process rather than treated as an isolated activity.
When well applied, it contributes to outage scheduling, prioritization of critical assets, validation of corrections, and reduction of operational risk. This makes the technique especially strategic in plants where electrical unavailability carries high cost.
Conclusion
Thermography in industrial transformers is a powerful tool for diagnosing thermal failures in advance, improving electrical system reliability, and strengthening predictive maintenance. The real gain lies in combining thermal capture, technical interpretation, severity criteria, and well-structured reports into a single decision process.
If your company wants to improve the level of thermographic inspections, organize reports, and prioritize interventions based on technical criteria, it is worth exploring how Thermal Reports can support that workflow.