The inspection ends, the report doesn't
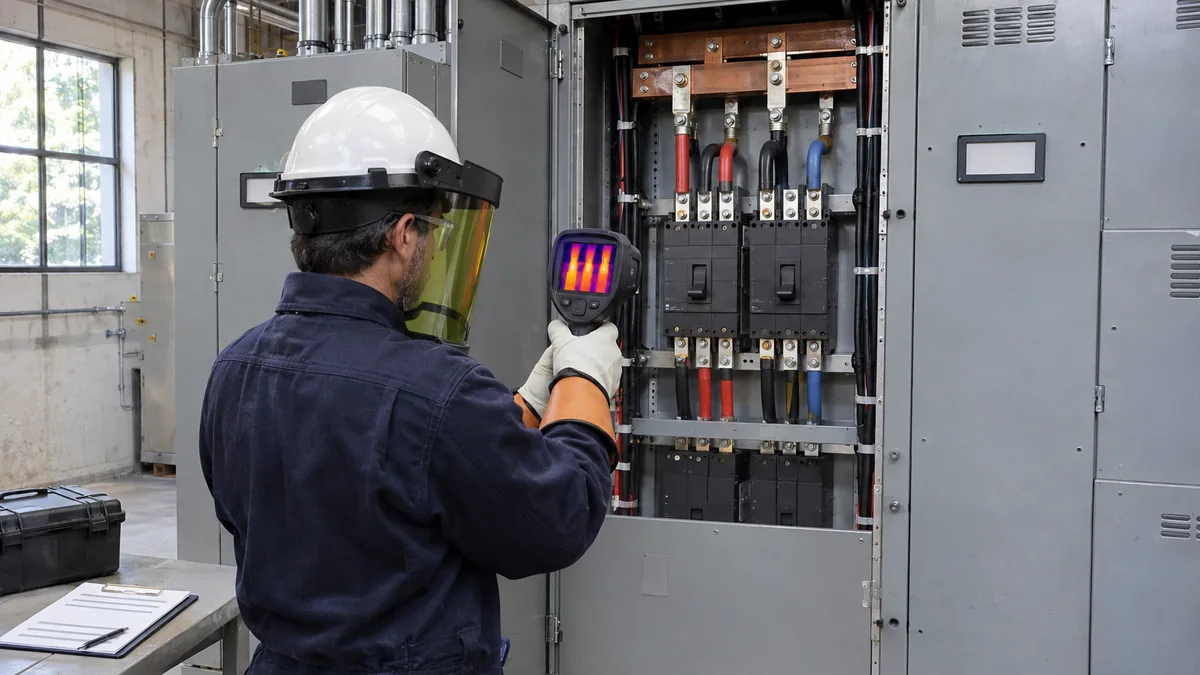
A thermography route through electrical panels can be finished in one shift. In many teams, the report for that same route still takes days to reach the client. Until it does, a hot spot classified as critical is just a note in a field notebook or an image on the camera's memory card.
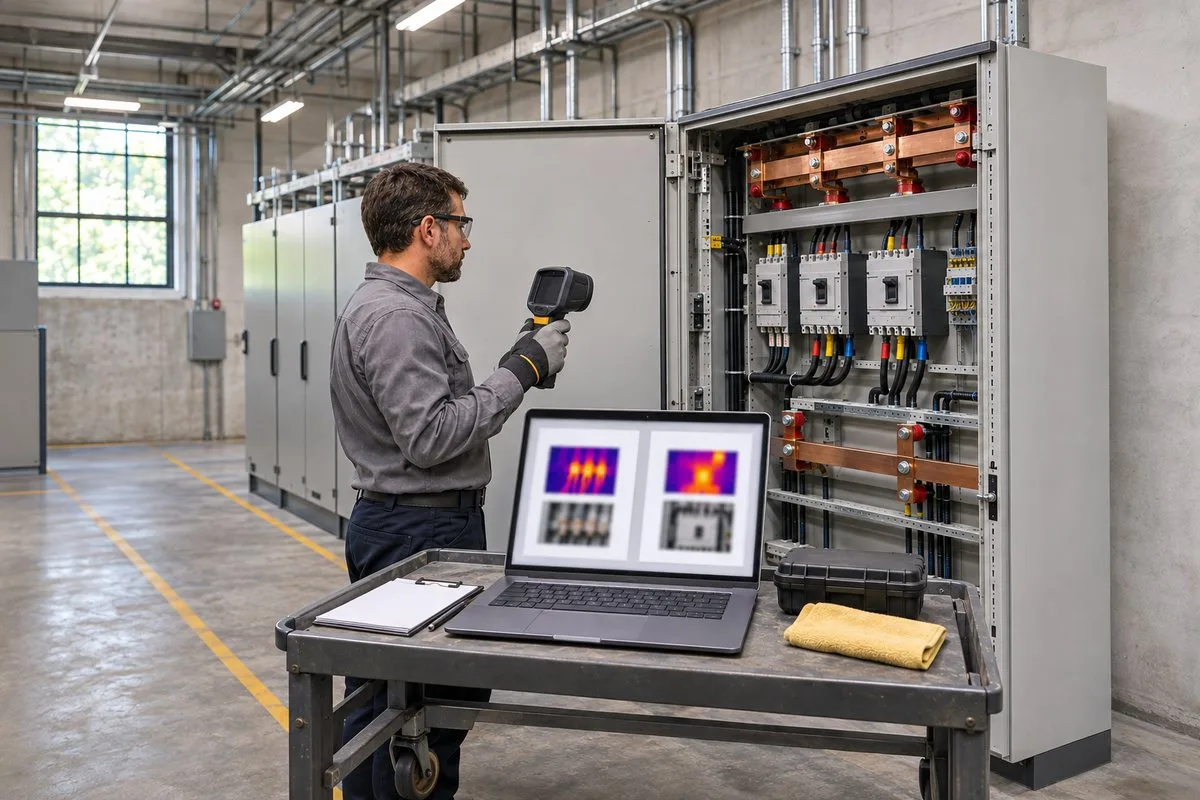
The time between the inspection and report delivery is not an administrative detail. It is the time during which maintenance still doesn't know what needs fixing. In this article, we show where that time goes and what can change in preparation, in the field and back at the office so the report doesn't take longer than the inspection itself.
Where the time goes after the inspection
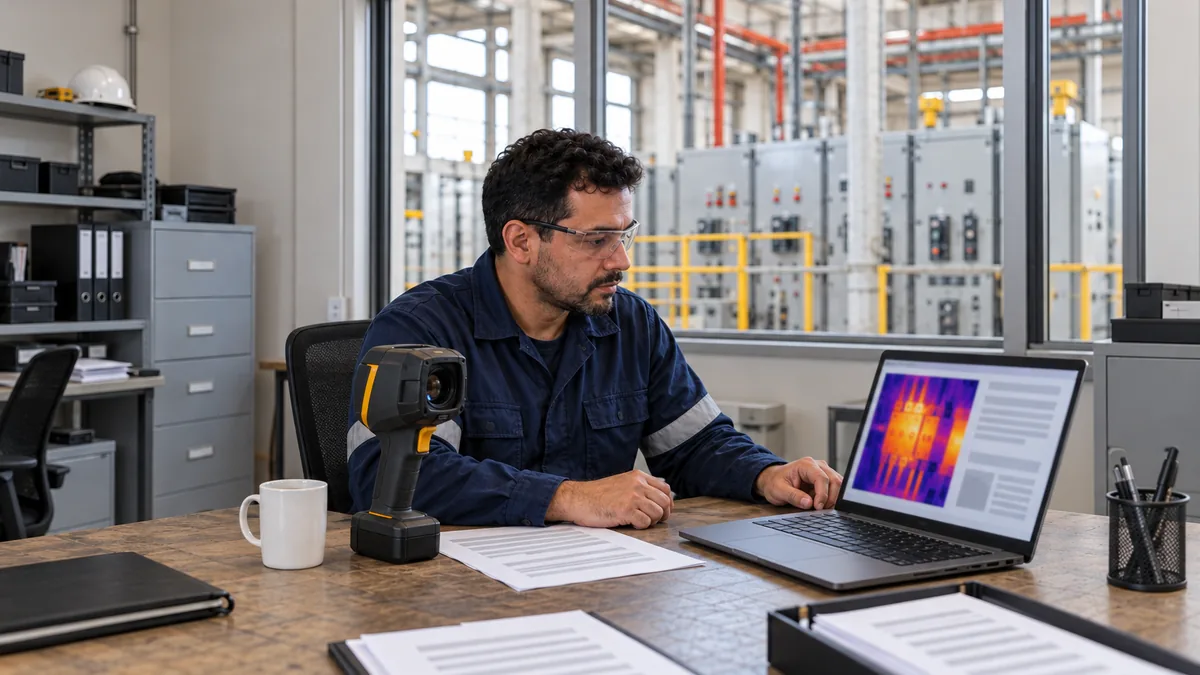
When the report is built by hand, the heavy lifting starts once the thermographer is back from the field. These are the steps that usually eat up the most hours:
- Downloading and renaming files. Dozens or hundreds of thermograms with the camera's sequential names, each of which has to be matched to the right panel, circuit and component.
- Matching thermal image, visual photo and field note. Which thermogram belongs to which tag? If the field notes weren't taken in order, rebuilding the sequence becomes an exercise in memory.
- Extracting temperatures. Opening each image in the camera software, measuring the spot and the reference, copying values into a spreadsheet or document.
- Re-rating severity. Calculating ΔT, choosing the criterion and deciding the priority of each finding far from the equipment, without the load condition written down.
- Formatting. Pasting images, adjusting tables, numbering pages, fixing layout in Word or a custom template.
- Reviewing and correcting. One mistyped value or a swapped image means redoing parts of the document.
When the team uses cameras from different brands, every step multiplies: each manufacturer has its own software, file format and report template.
Why the delay is a technical risk, not just a nuisance
Thermography exists to find failures before they turn into downtime or fire. A critical finding only leads to action once it reaches the people who can schedule the repair. If the full report takes days, so does the decision.
There is a second effect: the further from the inspection the report is written, the greater the chance of losing information. Circuit load at the time of the reading, the emissivity used, notes about the environment and the reference used for ΔT are easily lost when they depend on the memory of whoever walked the route.
What shortens the path from inspection to report
Before going to the field
- Route and assets defined. Having the route's panels and equipment registered with clear identification avoids figuring out later which asset each image belongs to.
- Severity criterion chosen in advance. The criterion should come from the maintenance program or a recognized reference, such as ANSI/NETA MTS, not be decided at the office after seeing the results.
- Report template ready. Branding, required fields and structure set once, not for every inspection.
During the inspection
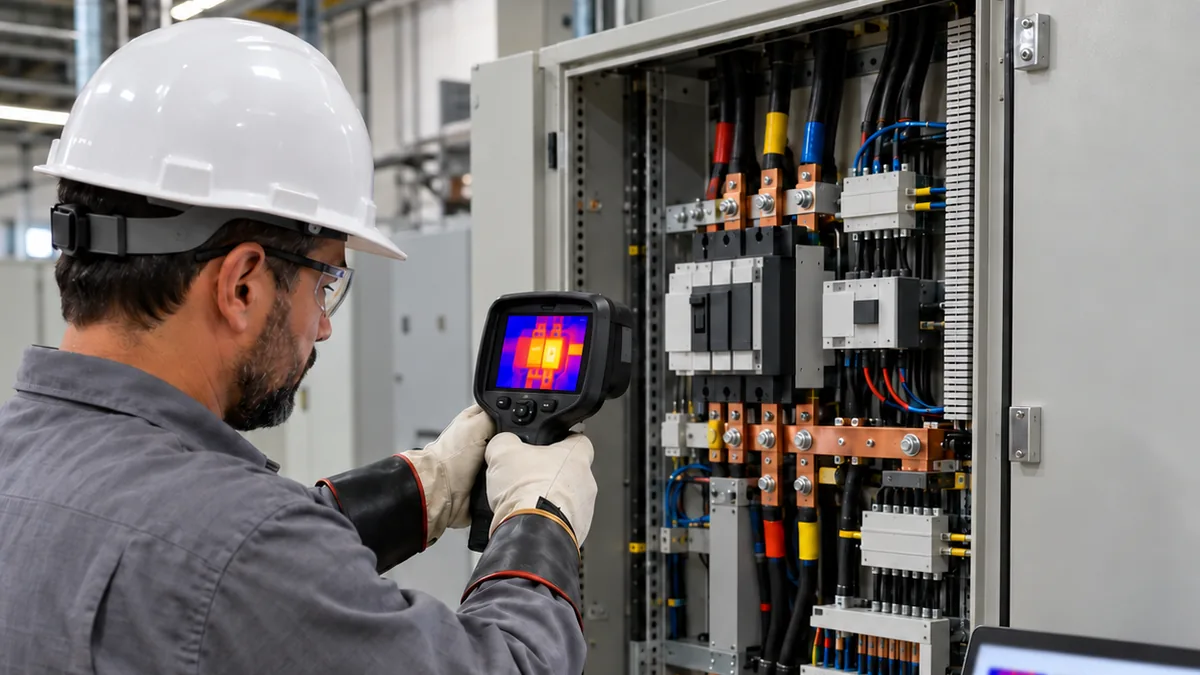
- Record against the right asset, on the spot. Each thermogram linked to the equipment and component at the moment of capture.
- Note load and measurement conditions next to the image, not on a separate sheet.
- Classify in the field whenever possible. The person standing in front of the component has the most context to assess the anomaly.
After the inspection
- Import without rework. Radiometric files read directly, with no temperatures typed by hand.
- Generate the document from the data, rather than assembling it from copy and paste.
- Review the technical content, not the formatting.
How ThermalReports handles this workflow
We built ThermalReports to take out of the office the work that doesn't need to be there. The platform runs in the browser and organizes the workflow in four steps: upload, analysis, report and delivery to the client.
- Multi-brand: the radiometric parser reads files from FLIR, Fluke and Hikmicro cameras, so the same team works with a single workflow and a single report standard, even with cameras from different manufacturers.
- Inspection routes: assets are organized into routes with sequencing and status, which reduces the work of matching images to equipment afterwards.
- Analysis and severity: each finding is classified and linked to the equipment, with the assessment criterion recorded. Automatic classification is assisted and remains the responsibility of the professional who signs the report.
- PDF report: the report is generated from the inspection data, with your branding, images and a findings table, aligned with ANSI/NETA MTS.
- Traceable delivery: each asset's history can be shared by QR code or link.
The goal is not to skip the technical analysis. It is to make sure the thermographer's time goes into analysis, not into renaming files and lining up tables.
One question to measure your routine
On your team, how much time passes between the end of the last route and delivery of the report to the client? If the answer is longer than the inspection itself, it is worth looking step by step at where the hours are going.
To go further, see also [how to compare methods for producing thermography reports](/en/blog/como-gerar-relatorio-termografia-comparar-metodos) and [how to standardize reports when the team uses cameras from several brands](/en/blog/cameras-multimarcas-um-padrao-relatorio-termografia).